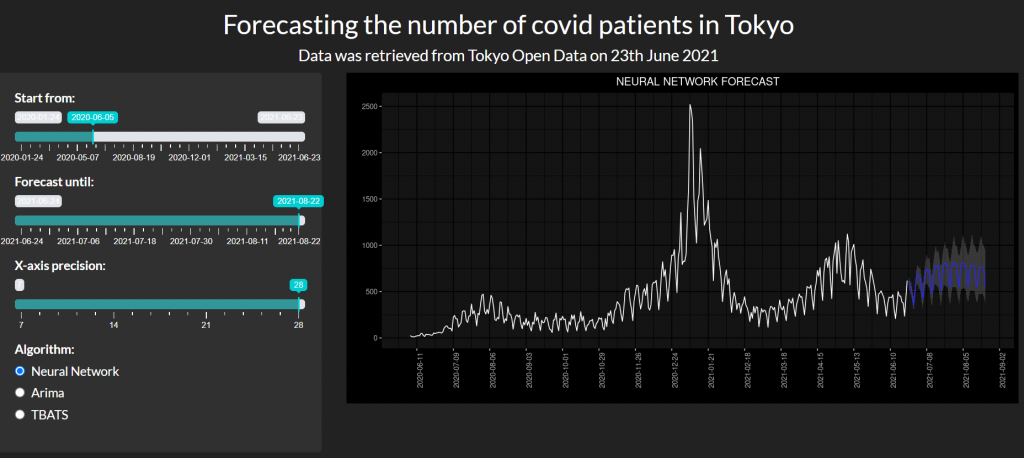
こちらでインタラクティブなグラフを操作できます
https://yuta-vet.shinyapps.io/shiny_app_deploy/?_ga=2.106368643.1882585030.1624518165-33520689.1624518165
前回の続きで、東京コロナ患者数を予測します。今回はneural networkを使用します。データの加工は、前回までにコードを載せていますので今回は省略します。既にデータはデータフレームからtsデータに変換しています。
今回もforecastパッケージを使用します。その中で、neural networkを選択します。60日後まで予測させます。
neural_network_fit = nnetar(tsdata)

autoplot(tsdata)+
  autolayer(forecast(neural_network_fit,h=60),color="lightgreen")+
  autolayer(neural_network_fit$fitted)
これだと、日にちがわからなくなっていますので、データフレームに戻してもう一度グラフを書き直します。
df_nn <- as.data.frame(forecast(neural_network_fit,h=60,PI=T))
df_nn$date <- seq(from=as.Date("2021/6/24"), by=1,length.out=60)
colnames(df_nn) <- c("PointForecast_nn","Lo80_nn","Hi80_nn","Lo95_nn","Hi95_nn","date")


ggplot()+
  geom_line(data=df2 %>% filter(date > "2021/3/1" & date < "2021/6/23"),
            aes(x=date,y=number))+
  geom_line(data=df_nn,
            aes(x=date,y=PointForecast_nn),color="red")+
  geom_ribbon(data=df_nn,
              aes(x=date,y=PointForecast_nn,ymin = Lo80_nn, ymax = Hi80_nn), alpha = 0.2)+
  scale_x_date(date_breaks ="7 day")+
  theme(axis.text.x = element_text(angle = 90))+
  ggtitle("Neural Network FORECAST")+
  theme(legend.position = "none",
        plot.title = element_text(hjust = 0.5))
来週あたり、さらに患者数が増えてしまうのでしょうか。早くワクチン接種率をあげたいですね。
